Continuous Improvement (CI): metrics, measurement and sustainment
Inherent in the definition of Continuous Improvement (CI) is the ability to determine whether you are truly making forward progress. To be successful, the metrics used for measuring CI require two things: 1) they need to be in a common format that everyone can use and understand, and 2) they need to be able to drive action. Choosing a scoring methodology is the key first step to success. For this reason, many manufacturers select Overall Equipment Effectiveness (OEE) as their key metric to identify the primary constraints in their operation and to reduce or eliminate it.
Terminology: understanding OEE and the Six Big Losses
In the 1960’s, Seiichi Nakajima established the scoring methodology of OEE and defined it as “a measure that attempts to reveal hidden costs.” Over time, it has proven to be an effective framework for measurement due its direct link between the component metrics of OEE and Total Productive Maintenance (TPM). TPM is a philosophy regarding how you should be evaluating, monitoring, and eliminating the six big losses in your production.
Data considerations: collection and standard work
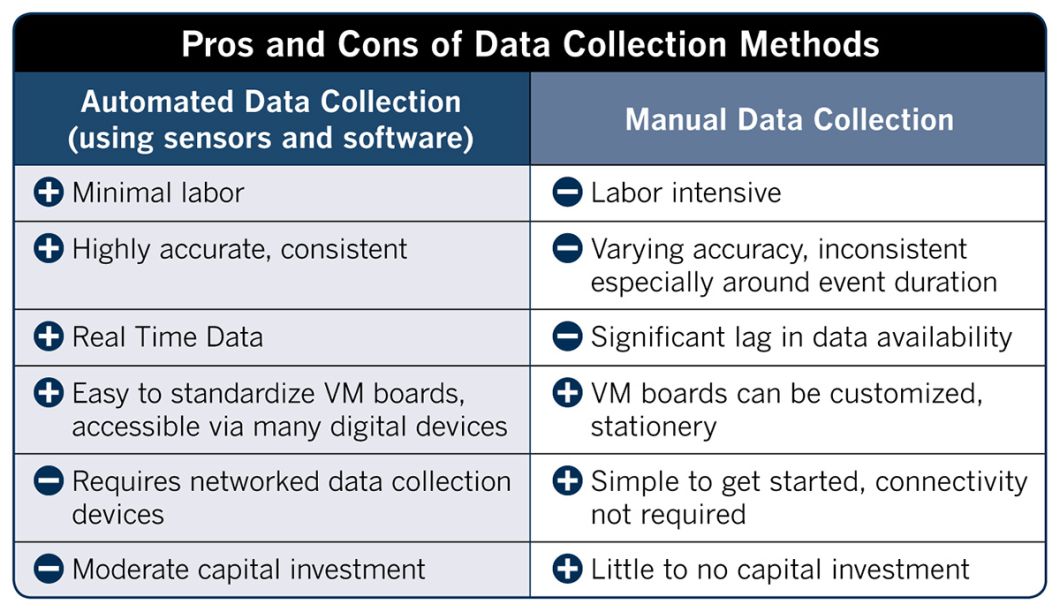
Before you can measure OEE, you will need to choose between manual and automated data collection (see the pros and cons of each in the chart below). To navigate this decision, you will want to first determine what data you need and who intends to use it. Then you will need to balance these against what data may be readily available vs. challenging to obtain. Standard work will also need to be created around data collection practices and additional inputs will need to be defined that provide context for the data. It is equally important to ensure there is standard work with respective owners clearly defined for the viewing, analyzing and acting on the data.
Calculating OEE: a snapshot
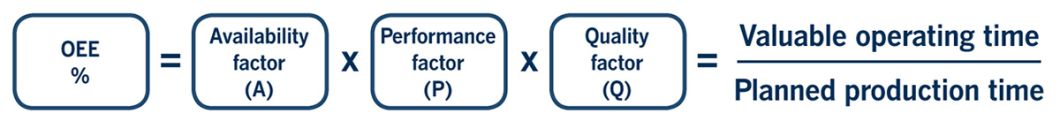
Now that you have thought through some of the nuances of data collection, you can move on to the specifics of calculating OEE. To properly calculate OEE, you need to have accurate baseline metrics for each of the three components — Availability, Performance and Quality.
Availability loss is typically thought as the inverse of downtime and is most frequently related to equipment breakdown. To calculate Availability and to help ensure an OEE measurement is truly reflective of a plant’s performance, you must be able to distinguish between unplanned downtime and planned downtime.
Performance loss reflects a line that is available and running, but at a rate that is below its maximum speed. The two of the six big losses associated with Performance loss include slow cycles (continual movement of the line, but at a reduced speed) and micro-stops (small stops that keep the line from running continuously that over time can add up to larger losses).
Quality loss is associated with production and start-up losses. Production losses include sporadic issues or events that create products that don’t meet quality requirements. Start-up losses are pertaining to materials that are wasted or thrown away at the beginning of production.
Defining success: what is a good improvement target?
As you are beginning your CI journey, determining your target for improvement should be a topic of discussion for the team. While suggested improvement percentages exist (a 60% improvement is considered “typical” and 85% is considered “world class”) and are seemingly helpful, it is advisable not to get caught up in these figures as you launch a CI program. There are too many variables that can affect your metric and therefore, your results. These can include variances based on your industry, the unique workflows of your operation, and in particular, the nuances of the implementation of your measurement system. Using these improvement targets as absolutes can lead to a false sense of security with a high score or an unnecessary sense of emergency with a low score. Your success is best determined by the establishment of a consistent measurement system that can indicate if you are improving and can help you assess the impact of your assigned countermeasures. Attainment of a specific target is best left to a later stage in your program after your CI processes are optimized and your targets individualized to your operation.
Start slow and grow your momentum
To grow momentum with the team and build a culture of CI, it may be advisable to start with something that requires lower effort to achieve, even if it only has a moderate impact. With growing success over time, you will want to be more rigorous in choosing items with increasing levels of impact. When selecting your initiatives, you will need to mindfully apply knowledge of your operation along with the Theory of Constraints to ensure you aren’t selecting an item that can’t be improved until another item is first acted upon. This advanced mindset usually comes at a more mature stage in the CI cycle and is handled by an optimized design of your data collection process.
Using visual management tools for success
So now that you have standard work around gathering data, a methodology for evaluating it, and a plan for establishing a consistent measurement system, now you can focus on sustainment. Here is where having an effective visual management tool is essential. Good visual management allows for the consistent presentation of data in an easily accessible format. An advantage to using a production tracking software for visual management is that it helps users to easily organize a series of standard visual indicators for optimized reporting. This reporting can be accessed by numerous users, on the line or away from it via various devices (e.g. a large monitor on the production floor, or remotely on a PC, tablet/mobile phone). A hand-written board can also be effective and can be customized to measure and display the data in a manner that fits your needs.
Above all else, a committed and consistent process of reviewing and acting on the displayed metrics is crucial to success. The best organized visual management board in the world is rendered useless and will serve only as decoration unless the key stakeholders continually review the data, align on its implications, and execute follow-up actions on a regular basis. It is for these reasons that it is advisable to write down the specifics regarding who will use the data, what they will use it for, how often they will review it. Also include the process for defining, assigning and agreeing upon action items and their expected outcomes over specified timeframes. Ownership, tracking metrics and countermeasures, and follow-through are also of utmost importance to driving and sustaining CI change.
Measuring effectiveness and sustainment
The ultimate goal of a CI program is for the OEE in the targeted area to increase, but new and additional factors might be contributing to the change and masking the effect of a countermeasure. While the best-case scenario is near immediate elimination of the targeted loss, that isn’t always possible. That is why it is advisable for team members to align, and commit to in advance, to improvement goals in terms of loss reduction and time period (e.g. achieve a 60% reduction in loss over 30 days) and for activities to be tracked on a regular cadence via visual management tools.
Implementation of a sustainable CI program is achievable with the right tools and thoughtful planning. Using data and OEE methodology as your guide, you can set baseline metrics and improvement targets, establish standard work, and track progress using visual management tools. With consistency and ongoing measurement, you can watch your success grow over time, better your production and establish a culture of continuous improvement.
Featured Downloads
Continuous Improvement Program white paper

See how easy it is to turn data into action with VideojetConnectTM